


Prof. Carl-Otto Weiss — Prof. Weiss is Advisor to the European Climate and Energy Institute (EIKE); Professor and Director, German Federal Institute of Metrology, Germany. This is the prepared text as edited of his presentation.
In this contribution I show you the results of a cycle analysis of 2,000 years of global climate data, the result of which is that Earth’s climate is determined by three main cycles, and that CO2 plays only an insignificant role.
But first let me mention how I became interested in the question of Earth climate. My research subject was everything related to lasers. Physics of Lasers, technical and scientific applications, e.g., spectroscopy and atomic clocks based on one singe atom, etc., etc. Even in the 1990s, for persons with scientific education, the self-contradictions of the official climate propaganda were obvious. Thus, the official narrative could not be true. We joked about the primitivity of the propaganda.
I did not have time to look deeper. I had 40 scientific coworkers, 10 of whom, to feed them, I had to find about $1 million each year. So that did not give me much time. But at retirement I had time. First I looked into the official models, and it is quite obvious where the fudge factors in the calculations are. But, then, I am an experimental physicist, so I got together with Horst Luedecke to analyze climate measurements.
In particular we did what is called Fourier Analysis, which means looking for cycles in seemingly irregular measurements in time series. Since this is the most common type of analysis in any field of physics or technology, we were surprised not to find any such work in the half-million publications of the climate literature. But then we said, “OK, if nobody did that so far, well, we will do that.” We published our analysis, and the reviewers confirmed that our work and conclusions were correct.
We reconstructed the terrestrial temperature history of the last 2,000 years using published local temperature proxy data [4]. Figure 1 [next page] shows the locations of the measurements on the globe and the type of temperature proxy.
The data comprise several hundred thousand individual measurements. Thus, by averaging to yearly values, the noise in the data can be much reduced. The global temperature history reconstructed in this way (Figure 2, annual data in grey) exhibits all historically known temperature extremes, such as the Roman Optimum (~0 AD), the Medieval Optimum (~ 1000 AD), the Recent Optimum (~2000 AD) or the Little Ice Age (~ 1500 AD). Even details like the Deep Minimum of 1450, known from the biography of Louis XI, show up. As to be expected, the reconstruction yields also the 1870–2000 temperature rise, which is officially claimed as due to human CO2 emissions.
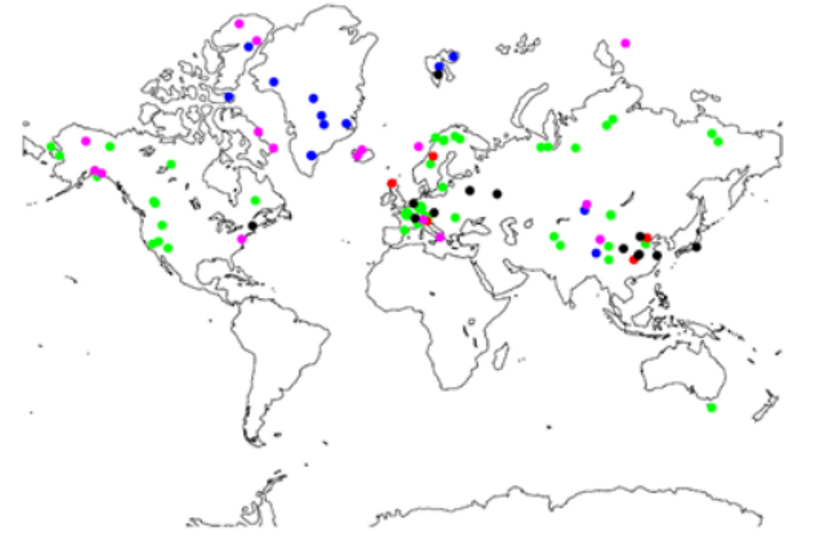
| Figure 1. Location of Temperature Proxies. Green: tree rings; Blue: ice cores; Red: speleothems (stalagmites, etc.); Magenta: sediments; Black: other. |
“Climate,” officially defined as the 30-year running average of temperature, is shown in Figure 2 (blue curve). The climate curve emphasizes the mentioned temperature features. The correct representation of the known historical temperature variations indicates that the reconstruction is realistic. We then Fourier-transformed annual temperatures (grey in Figure 2). The resulting spectrum Figure 3 shows three dominant cycles with periods of ~1,000, ~460, and ~190 years. These cycles were already known from local studies, (Eddy-, Babich-, De Vries cycles, respectively). This confirms once more that the reconstruction is realistic, and excludes [the possibility] that the dominant cycles could be mathematical artifacts.
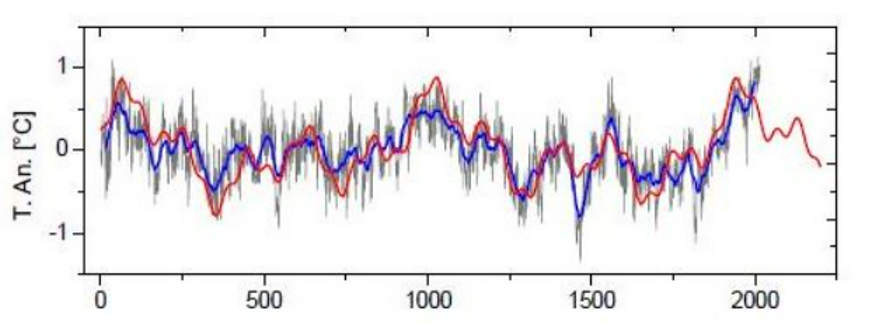
| Figure 2. Temperature history over the past 2,000 years (grey: annual values; blue: “climate”—30 year running average; red: sum of the three dominant cycles). |
For those less familiar with the Fourier transform, we mention that periodic variations (cycles) show up in the spectrum as sharp peaks (such as the three main cycles of Figure 2). Non-periodic variations, e.g., monotonically rising or falling, show themselves in the spectrum as broad continua.
In Figure 3, broad continua are not visible. This suggests already that non-periodic variations in the temperature, such as warming due to human emissions, are absent. However, broad spectral continua may be masked by noise. To exclude such a possibility, we transformed back to the time domain.
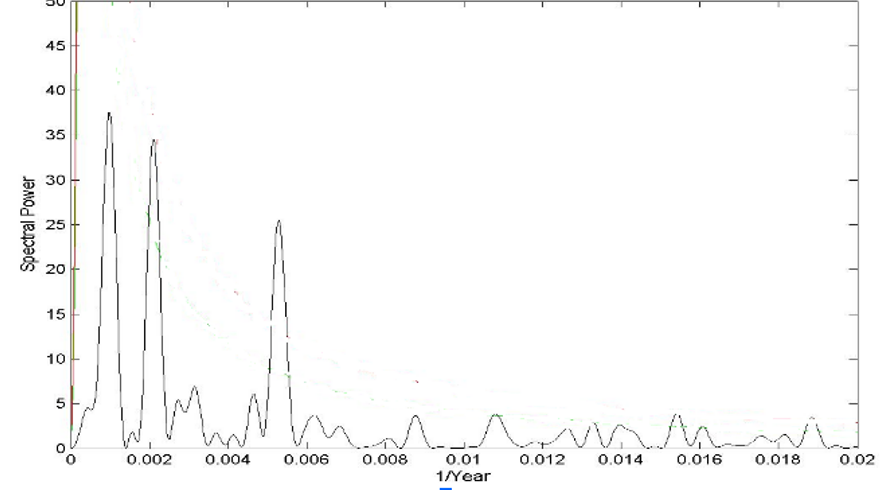
| Figure 3. Spectrum of the 2,000 years’ annual values, showing three dominant cycles with 1,000-, 460-, 190-year periods. |
Figure 4 shows the three main cycles in the time domain (amplitudes normalized for clarity). The sum of the three dominant cycles (red curve, Figure 2) agrees with the climate (blue curve) remarkably well (correlation 0.85). The sum of the three cycles represents, notably, also the temperature rise for 1870–2000.
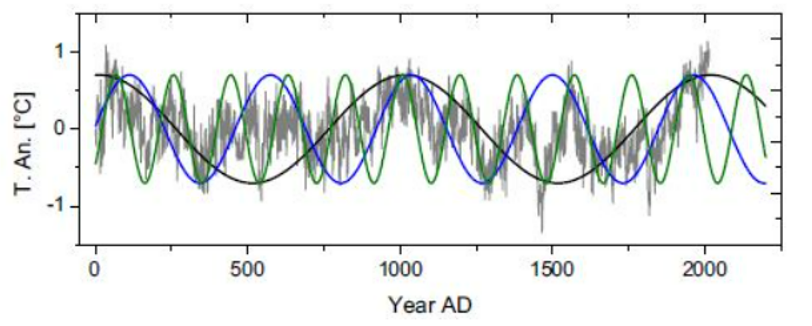
| Figure 4. The three dominant cycles in time domain (amplitudes normalized for clarity). |
I emphasize this result again: the warming from 1870–2000 is due to the three main natural climate cycles. And not due to CO2, as claimed in the official propaganda.
The difference between the reconstruction (grey or blue values, Figure 2) and the cycle sum (red in Figure 2) around 2000 AD would be compatible with the recent estimates of CO2 climate sensitivity of ~0.5° for CO2 doubling. (See, e.g., [5] and Figure 5), certainly unimportant for life on Earth. The three cycles with their amplitudes and phases, thus allow calculating the essential climate changes for the past and for the future.
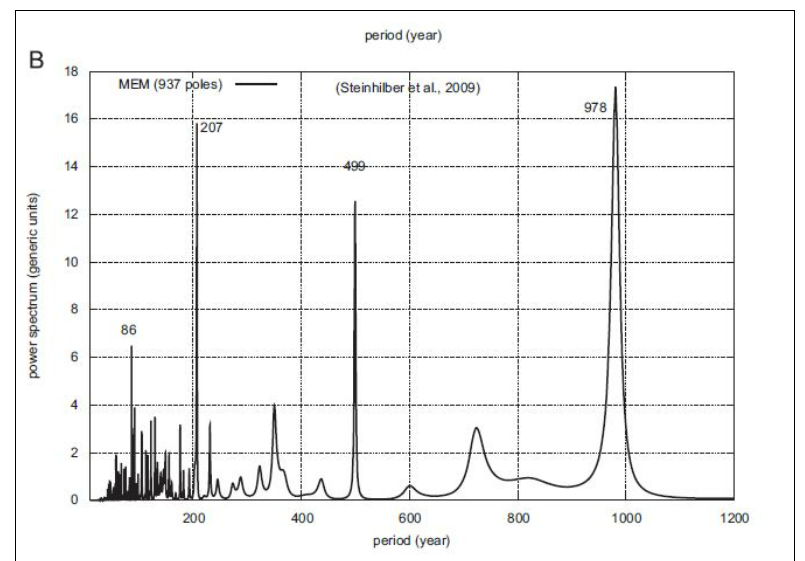
| Figure 5. Periodogram of 8,000 years of solar activity, showing three dominant cycles [6]. Note the correspondence of periods with the dominant climate cycles of Figure 2. |
We can ask further about the origin of the three dominant climate cycles. I found [6] that these agree remarkably in periods with the three dominant cycles of solar activity (see Figure 4). The mechanism by which solar activity (i.e., “solar wind”) affects Earth’s climate, is well understood [9]. It follows that the cycles of solar activity determine the terrestrial climate.
Interestingly, Scafetta [6] shows that all principal solar activity cycles can be explained by the motion of the planets (particularly Jupiter and Saturn), and the planetary tide forces acting on the solar magnetic field generator (the mechanism by which the tide forces of planets influence the solar activity has recently been clarified [8]).
The main result of our analysis is that the global warming from 1870 to the present is natural and not man made, and that it originates from the three dominant cycles.
The continuation of the three dominant terrestrial cycles into the future indicates cooling until 2070 . The recent continuation of the rise of the climate curve (blue) as different from the cycle sum (red) may indicate the small contribution of CO2 of 0.5°C per doubling of the CO2 content of the atmosphere [5], which is certainly unimportant for life on earth
Summarizing, I mention that this analysis, along with many others, disproves all official propaganda claims of a dangerous warming due to CO2.
A first independent confirmation of our results, namely that the 1870–2000 temperature rise is natural, was given recently, using pattern recognition on temperature proxies [7].
Finally, just to give a taste of the surprisingly primitive propaganda lies, I mention only three of them. Fig. 7. {Slide 7. Three examples of totally wrong propaganda claims.}
References
1. See, e. g., https://www.tmgnow.com/repository/solar/lassen1.html
2. Steinhilber, F., Beer, J., Froehlich, C., Geophys. Res. Lett. 36 L19704
3. See, e.g., Wagner, G. et al. Geophys. Res. Lett. 28 (2001) 303-306
4. Luedecke, H.-J., Weiss, C. O., The Open Atmospheric Science Journal 11 (2017) 44-53
5. Microphysics of Atmospheric Phenomena B. M Smirnow, Springer Atmospheric Schiences ISBN 978-3-319-30813-5; DOI: 10.1007/978-3-319-30813-5
6. Scafetta, N., Journ. Atm. and Solar-Terrestrial Phys. 80 (2012) 296-311
7. Abbot, J., Marohasy, J. GeoRes 14 (2017)36-46
8. F. Stefani, A. Giesecke, T. Weiter; Sol. Phys. (2019) 294: 60
9. H. Svensmark, M.B. Enghoff, N. Shaviv, J. Svensmark, NATURE COMMUNICATIONS, DOI
10. 1038/s41467-017-2


